Thursday, December 26, 2013

Creating a Pareto Chart in Excel (Video Lesson)

Wilfredo Pareto was an economist who looked at the wealth distribution of Italy in a different manner. He created the famous 80/20 rule in which the critical few and the trivial many need to be separated. Pareto's principle has been applied to many different industries and situations over the years. According to Pareto, in most cases, 20% of a process potential cause(s) may contribute to 80% of the process potential symptoms. The tool has been extremely important in providing the quality practitioner with focus and prioritization when dealing with any process improvement program.

While many of us have advance software to quickly plot data into quality tools such as the Pareto Chart, there are some who do not have access to these tools. With that in mind, we have prepared a 10-minute video lesson on How to Create a Pareto Chart in Excel without the need to install any ad-ons or specific macros. Enjoy the video lesson posted below (a link is also provided at the bottom of this post). Please let us know if we can be of any further help. If it looks a bit blurry at the beginning, just give the HD quality a few seconds to load. 

We would also like to wish everyone in our community of learners a very successful and peaceful 2014. We hope to see you in one of our webinars, open enrolment courses, or consulting engagements. Happy New Year everyone!


Video Lesson on YouTube: 
https://www.youtube.com/watch?v=TuVeQ9Q5Eqs

Wednesday, December 18, 2013

An All Inclusive Strategy Development Approach

Should strategies be developed within the four walls of a boardroom or should they be discussed with key players of the organization? Should they be imposed to all levels of the organization or should they be shared equally throughout the organization? Is there a better way of doing it? It is difficult to believe that strategies should be developed by a few whom, rightfully so, are in charge of the organization. The formulation of strategies needed to take the firm to where it intends to go, should be an all inclusive exercise, especially in mid-size organizations where the process of developing strategies can easily involve most of the organization's human resources.

When developing strategies for the organization, the owner(s) or senior leadership should consider the following steps, which somewhat mirror what Norton and Kaplan suggest in their popular BSC (Balanced Scorecard) method (previously addressed within this blog).

 1. Interview senior managers as well as operational key players. Ask them “what is going on right now” and where they see the organization headed, and why they feel that way. Needless to say, the “operator” (be it the customer service representative or the sales person) often knows much more about what goes on at the operational level than the owner of the organization.

2. List all similarities discovered in the process. Is there a common theme in the employees’ answers? Is there a common issue? Does what you hear from the shop floor align with what senior management have in mind for the organization?

3. Focus on a few critical performance indicators that are in fact aligned with the overall goals of the organization. You can use these indicators as the basis for your strategic plan.

4. Brainstorm with those who have provided you with input. Why the similarities? Why the discrepancies?

5. Reflect on whether or not what you had in mind for your main strategy (or strategies) is actually doable, reasonable, and more importantly, what your customers expect of your organization. For one reason or another, you may be taking the organization to a completely different destination when compared to what your employees and the market are seeing it going.

The exercise of involving various key players in the strategy formulation will serve you with, at least, a good picture of what’s intended by leadership and what’s perceived by the employees throughout the entire organization when it comes to its direction (the firm's strategies.) Involving other levels (rather than senior management only) in the strategy formulation process can be a powerful tool for alignment and understanding. Think of a soccer team that has been told what to do in the field but yet have no idea about what the rewards (and roadblocks) involved in the task are. The team can still get the job done, but it would be much easier and rewarding for all if the team players have a common purpose in mind.

eZSigma has recently launched its Strategic Management programs. To learn more about them, please visit www.ezsigmagroup.com. We have also started an early bird promotion for all Open Enrolment (OE) courses. Please contact us for more information on how you can get discounts on all courses offered by eZSigma Group.

Tuesday, December 10, 2013

The Seven Quality Tools

More often than not, we find ourselves dealing with problems and improvement opportunities at our workplaces. But equally interesting, not everyone looks into these issues from a more statistically-sound perspective. The result is that inevitably, decisions sometimes are made based on opinions, desires, misinterpretation of facts, and "gut feeling". As quality practitioners and as process improvement champions, we should always look for factual data analysis that support decision making. One of the simplest approaches we can utilize to tackle unresolved and/or unknown problems is the development of a process improvement team (PIT) with the help of simple and yet powerful basic quality tools. If your organization is currently facing issues that have yet to be resolved, you may find the information on the Seven Traditional Quality Tools of great relevance.

The Seven Traditional Quality Tools are:

Stratification: (some authors replace this quality tool with Flowcharts): the simple act of segregating data in a meaningful way so that the user can properly study the data collected. This technique allows the analyst to group different data into homogeneous stratums. Many quality practitioners use this quality tool as the very first step in a process improvement team (PIT) approach to problem solving.

Check-sheet: basic document that offers the analyst with the opportunity of checking the number of occurred events. Imagine that a count on the number of complaints an airline customer representative needs to log per day must be performed. Although it sounds like a rather simplistic tool, the data collected through the check sheet can be of valuable insight by for example, serving as an input to other quality tools (such as the Histogram).

Scatter Diagram: a useful tool to understand the relationship between two variables. Questions associated with Scatter Diagrams are: what happens to X when Y increases or decreases? How strong is the relationship between the two variables? What is this relationship telling the analyst? And what is true or false in the relationship? Example: the hotter it is outside the more water one drinks. Is the opposite also true? (More on Scatter Diagrams on this blog, please check the archive on the right hand side bar).

Histogram: this bar-type chart measures the frequency in which events occur. It is a very valuable tool when the practitioner needs to study how often a certain event occurs, and how the repetition of such events behave within a certain period of time, in other words, it studies the distribution of data over a period of time. Think about a study in which you need to understand when your peak sales occur more often. It also is a great visual tool for those who are not very familiar with statistical analysis.

Control Chart: this line graph shows the user how the data behave over a period of time (often continuously). The user can set up rules to identify abnormal behaviours (e.g. out of limits or seven points climbing or descending in a row) and analyze the process as it happens over time. This is a powerful tool that can predict issues in many processes.

Ishikawa Diagram: also called “Cause and Effect” or “Fishbone” diagrams. This graphical representation of the relationship between the symptom of the problem and its various possible causes is a great way of discovering more about the root cause of an issue. It helps the user in digging deeper and truly analyzing the root cause of the problem. (More on Ishikawa diagrams on this blog, please check the archive on the right hand side bar).

Pareto Diagram: a bar-type chart that helps the user in identifying the critical few versus the trivial many (Pareto’s 80/20 rule). Many times managers focus their energy on things that are problematic per se but not of great impact at the bottom line (bottom line as not only financial performance but also employee engagement, safety, and so on). The Pareto diagram helps the analyst in focusing on what really matters.

The eZSigma Group has recently launched a course on the Seven Quality Tools. Please visit the link below to learn more about this learning opportunity.

Wednesday, December 4, 2013

Lean, Six Sigma and Sustainable Technologies

Once upon a time, there was a manager who needed to hone his skills on teamwork. Back then, the only option he had was to sign up for classes in which the student and the professor interacted face-to-face in a rather lecturer-listener setting. Through the evolution of the internet, and most importantly e-learning, nowadays students and practitioners have many options to choose from when it comes to self development. There are courses, certificate programs, masters and even doctoral degrees being delivered fully or partly online. The internet has undoubtedly changed the way we learn. But not only has the internet changed the way we learn, it has also changed the way we access and use information on a daily basis. Think about booking a trip, shopping for a new car, getting tickets for a concert, and even conversing with a loved one on the other side of the planet. As well, technology has changed the way we work. It has changed the way we control processes, the way we deliver services, and the way we communicate with each other.

Now that we have touched on how technology has changed the world, let's address what we know best: process improvement methodologies and techniques. As Lean and Six Sigma practitioners, we are very aware of how we need to approach customers to deliver the best in process improvement. But what about the sustainability of such programs? As we all have seen, many initiatives fail to stay if champions are not present to keep them going - which is indeed a major factor. But what about the technology behind these initiatives? Can software solutions contribute to the continuance of Lean and Six Sigma programs? Can they at least help somehow? Or is it just about the organization's culture? Have you experienced issues with Lean and Six Sigma implementation due to the lack of a tool or solution that could help the organization with the program's longevity?

This post is a bit different from the ones posted before. We would like to provoke the reader with this question: as we move towards a quasi-completely technology-driven business environment, can improvement process programs and methodologies such as Lean and Six Sigma be sustainable in the long run without the adoption of some sort of technology suite that will ensure that such programs stay, and are not considered the flavour of the month? Please vote on our first poll on the top right hand side of this blog and let us know what you think. And please feel free to comment on this post if you feel like it - we'd love to hear from you.

Tuesday, November 26, 2013

Fishbone Diagrams

The fishbone diagram is one of the simplest - and yet powerful approaches to root cause analysis one can find in the traditional 7 Quality Tools package. It is also called Ishikawa Diagram (due to its creator Kaoru Ishikawa) and cause-and-effect diagram. The tool provides the quality practitioner with two powerful features: 1) it is visual and easy to understand, 2) in most cases, it is built during a brainstorming session - which means it involves the people related to the topic being studied. Ishikawa diagrams are qualitative in nature, and should be supported by data and data analysis through the use of other statistical tools. Nevertheless, it offers process improvement teams (PITs) a methodical way of looking into the possible cause(s) related to an outcome. The first step needed to create the diagram is to write down the problem or undesirable result in the "head" of the fish. Then the diagram should be completed by adding "branches" (or bones) that are relevant to the issue being investigated. The figure below suggests six important and commonly used branches.


Materials is the branch related to the physical assets that may be related to the issue or problem statement. Raw materials for example, could be the cause(s) of a poor quality product. Methods refer to the standards and procedures in place that may not be performing well. Machines is the branch that covers the equipment utilized in this particular process - obsolescence as well as wear and tear may be the cause(s) of the the fishbone diagram's problem. Measurements may be related to calibration as well as system and/or machinery metrics that are not delivering accurate readings of the process. Environment can be looked at as both internal environment in which the process performs and the external environment in which either the product itself or the inputs to the process may be contributing to a undesirable outcome. People: is the lack of training, skills, and even motivation causing the process to be a poor one?

Keep in mind that depending on the issue being studied, these headings can be easily adjusted. The most important aspect of a cause-and-effect diagram is to identify the possible cause(s) of a problem. Notice that in the depicted figure above there are sub-branches for each major branch. The quality manager should explore and break down the possible cause(s) as much as possible until the true root cause(s) of the problem has(have) been identified.

As mentioned at the beginning of this post, the Ishikawa diagram is a powerful, easy to understand, and pictorial tool that can be used by any organizational setting, either as a part of a large process improvement study or in a quick meeting that needs to address a small  and specific issue. Give it a try! As usual, our team at eZSigma is available to help in case you need a hand.


Monday, November 18, 2013

Balanced Scorecard (BSC)

We are very excited to announce that our Strategic Management program has now been officially launched. eZSigma is now offering two streams of work within the Strategic Management program: consulting and training. More information can be found on our website (see link on the right hand side). We would like to take advantage of this opportunity to address the methodology behind our new offering: Balanced Scorecard (BSC). Although it is nearly impossible to touch on all aspects of BSC in one post, we hereby address the main idea behind this powerful approach to managing organizations. The BSC methodology was created in the early 90's by two Harvard professors - Norton and Kaplan. The main idea behind the BSC is that a firm should not only be concerned about its financial achievements but rather, it should seek excellence in other areas that will ultimately support the company in achieving its financial performance. The approach did break a paradigm in a sense that it supports the concept that no longer a firm would be focused on and concerned about its financial performance only. The methodology calls for a few critical points:

1. The translation of the strategic mandate into operational metrics
2. The alignment between operational metrics and the company's strategic objectives
3. The causal relationship among the four perspectives (briefly described below)
4. The spread of accountability and autonomy to all employees ("everyone's job")

The BSC method is built upon four perspectives: financial, customers, internal processes, and learning and growth. There are variations of these perspectives, mainly in the wording, but these four are easily found in any BSC development in any industry. The four perspective are:

Financial: Norton and Kaplan do not disagree that firms can only move forward and reinvest in themselves through monetary funds. But financial performance can only happen with  satisfied customers. For not-for-profits, revenues are still important for the organization's further development and the BSC approach can also be applied.

Customers: simply put, no company can survive without customers, and no company can thrive without satisfied customers. The BSC approach calls for attention when it comes to keeping your customers happy. In turn, these customers will continue to do business with the company and provide it with earnings longevity. As a side note, depending on the type of company and industry, the BSC practitioner can be dealing with internal and/or external customers (the next step in a process or the final consumer).

Internal processes: no customers can be satisfied through processes that lack quality in them. Pursuing excellence in any internal process - be it in a manufacturing setting or at a service organization, is the key to customer satisfaction. The previous post on cost of quality touched on the various ways that the lack of excellence in processes can contribute to customers' dissatisfaction.

Learning and growth: companies are made out of people. Processes and products, even those that are highly automated demand people to control and operate them. Engaged, well trained, and committed employees are the foundation of the firm's ultimate success. Think about the best products available on the market today. They were designed by people, they were created by people, they were advertised by people's minds.

The visual aid used in the BSC approach is the Strategy Map which we will address in another post eventually. We hope that this post has given the readers a glimpse of what this powerful approach can do in any organizational setting. As usual, we are available to discuss how this and other eZSigma's programs can transform your organization in a excellence-driven one.

Tuesday, November 12, 2013

Cost of Quality

How does one put a dollar figure to quality-related activities? In this post, we address the main areas of concern when it comes to financially measuring quality (or the lack of). Cost of quality refers to the costs of not producing a quality product or service. It is an important measure that showcases how much, dollar-wise, a firm is spending on activities that need to be performed in order for the product or service be of an acceptable quality. With a bit of variation in the literature on cost of quality, the main four areas of concern, and  the areas in which you can build a case for justifying doing things right the first time, are:

Prevention costs: what are the costs related to avoiding an issue with a product or service? Consider quality planing, training, preliminary process evaluation, management systems development, product design inspection (or verification), and so on. These are the costs a company must address even before it starts to produce a good or deliver a service.

Appraisal costs: calibrating, auditing, acceptance-testing, inspecting, and any other cost associated with the checking phase of a product or service development. Companies that are TQM-oriented usually educate employees to be a constant checker, however there are still clearly identifiable appraisal costs in any organizational setting.

Internal failure: these costs include scraping, reworking, downgrading, down-valuing, and material-reviewing to name a few. This is perhaps the most easily and visually identifiable costs of any process. It is important to mention that for the service industry, these can also be related to data loss, disruption in service, and errors in processing orders.

External failure: the costs that any organization want to avoid at all costs (no pun intended). Not only this is about cash outflow but it also refers to issues in which a company does not want to have. Warranty issues, product recall, defects, returns, complaints management, and the one we should be most concerned about: the loss of reputation.

Be mindful that sometimes certain costs (such as prevention costs) may deliver a reasonable benefit after all. Perhaps it is there that quality practitioners should be more focused on, in order for the product's or service's other costs be minimal. Evaluating the right costs is an important piece of any quality or process improvement engagement. eZSigma can help your organization in successfully achieving this milestone.

Monday, November 4, 2013

5 Whys - A Simple Tool for Root Cause Analysis

It turns out that as kids we knew better: ask Why? 5 or more times to discover the reasons behind the need to go to bed earlier or to understand why dad needs to leave the house in the morning every single work day. But what have we learned about asking Why? over and over again since our childhood, and how can we use this knowledge as process improvement practitioners? This approach is very intuitive indeed, but perhaps not so much utilized as an effective, easy-to-understand, hassle-free tool for quickly identifying the root cause of a problem. Formally described as the 5 Whys technique, it was made popular in the 70's by Toyota and its Toyota Production System (TPS). By asking Why? 5 or more times, one can dig deeper into the cause(s) that are actually creating the symptom. Just as we did by often asking our parents Why? a dozen times in a role - on any subject matter, we can now apply this simple tool in our workplace. Let us use a simple example to understand the power behind such a modest concept. In this post, we also address the next steps to be taken after the root cause of a problem has been found.

Issue: loss of a customer in a busy downtown coffee shop.

Why did we lose the customer?
Because there was a very long line around rush hour.

Why did we have a long line around rush hour?
Because one of our new baristas could not make coffee as fast as requested by our standard.

Why couldn't this barista perform as fast as requested by the standard?
During training, our main coffee maker was not working properly. The barista never really learned how to effectively make coffee as per our standard.

Why wasn't this coffee maker working properly?
The technician responsible for fixing it did not show up to fix it.

Why didn't this technician show up to fix it?
Because we haven't paid the last bill from the service provider.

The points of this fun exercise are twofold: 1) often we think we know the root cause of a problem but not very often we study what really happened. In this example, the first thing that comes to mind is that it was rush hour, and the demand in the coffee shop was higher than usual - an easy to accept excuse to explain the loss of a customer. 2) the root cause of a problem can be sometimes something completely different from the first one we tend to elect as the root cause. As human beings we naturally tend to jump to conclusions but as process improvement experts we should always investigate the issue a bit further, and always dig deeper into the many other possible causes of problem, even when they seem to be so convincing at a first glance. 

What comes next? An action plan to address the root cause(s). This action plan must at least identify a person accountable for the action, a deadline to complete the action, and a follow-up report on it: this will provide your organization with the lessons learned for the future.

We are experts in process excellence. Please contact eZSigma for any further discussion on how we can help your organization to perform better.


Monday, October 28, 2013

SIPOC, Understanding Your Process' Elements

Utilized for process elements identification, and usually applied in the Measure step of  the DMAIC approach to process improvement (see posting on DMAIC within this blog), a SIPOC diagram is a useful tool to understand what your process is made of. It is visual, it lists the main components of each of the main foundations of a process, and can easily be applied in any industry. The acronym SIPOC stands for Suppliers, Inputs, Process, Outputs, and Customers. SIPOC expands on the basic operations management concept of input-transformation-output, by adding those who supply the raw material and/or information (suppliers) and those who ultimately receive the product being produced or the service being delivered. To illustrate such effort, we have chosen an easy process, one that many of us have undoubtedly performed before: making a peanut butter and jam sandwich.

Let us consider the figure below:


Suppliers: in this example, we want to know which organizations are actually supplying the tools, raw materials, and/or information we need to kick off my process. Grocery store, Hydro co., and hardware store.

Inputs: in this column, we want to list all of the needed supplies my process needs to produce the product or deliver the service. When working with process improvement initiatives (such as Lean), the idea is to build a SIPOC on a "as is" basis, i.e. current state. Here we have bread, peanut butter, jam, and other supplies.

Process: what are the steps needed for the process to transform the inputs into something else? Be mindful of processes that produce a good or deliver a service: either way, there will always be transformation happening, and that is the main point here. As you can see from the figure above, we have listed the steps needed to make the inputs become the product.

Outputs: simply stated, the goods and/or services being delivered: a peanut butter and jam sandwich in this example.

Customers: these may be your final consumer(s) or perhaps the next process that receives what you are in charge of producing/creating. In our example: hungry kids rushing out of the house in the morning.

The usage of a SIPOC diagram can effectively help your organization to develop a pictorial mapping of your processes' elements along with their gaps. Through its various process improvement programs, eZSigma can help customers of any industry to develop, apply, and sustain process improvement initiatives. Get in touch to learn more about eZSigma or visit our website at www.ezsigmagroup.com 

Monday, October 21, 2013

Lean Methodology, The 8 Wastes

It is well known that we, as human beings, undoubtedly always waste resources, be it at your manufacturing setting or at home. Restaurants, hospitals, schools, airports, the list goes on. There is always waste being generated. But more than physical waste, we also always waste time, opportunities, and often, the chance of utilizing people's real talent. The LEAN methodology has brought to us the concept of the 8 wastes, and as incredible as it may sound, every single organization still has plenty of opportunities to start working on waste elimination right now. We would like to offer our captive audience a brief posting on the 8 wastes from what our experienced cast of consultants has learned about waste elimination.

Transportation: physically moving products and people around due to a poor flow of events. Have you found yourself going back and forth from the kitchen simply because the flow of your activities during dinner is all over the map?

Inventory: not only about perishable raw materials that have no need in being purchased ahead of time, but consider the cost of inventory - money sitting on shelves for no reason. The best inventory management practices are the ones focused on JIT (Just in Time).

Motion (or movement): this is about ergonomics, in any sense. Bending, lifting, turning. Layout is extremely important for process efficiency, besides of course, being critical of employees' health.

Waiting: for parts, information, human resources, raw materials, and equipment. In a manufacturing setting, waiting means a waste of money more than anything. In the services industry, it means that you can make it or break it when it comes to customer satisfaction.

Over-production: a classic waste due to inappropriate production planning. Making more than the process really needs creates waste in its purest form. The best practices on this waste elimination approach is the pull system (producing as required), something that Dell Computers and Toyota do effectively.

Over-processing: having too many non-value added steps in the process. Doing things for the sake of doing them. A great way of analyzing what your process current is (current state) and can be (future state) is the VSM tool (Value Stream Mapping).

Defects: an easily identifiable wasted resource, product, or service. It includes re-work, scrap, and corrections. Quality gurus such as Deming and Crosby have stated important advice about "doing it right the first time" and "aiming for zero defects."

Talent and Skills: making workers push the buttons is no longer acceptable. Delegating tasks without training is the road to failure. This is perhaps the most saddening of all wastes. Not utilizing the right talent and skills of the right people on the job is detrimental not only to the entire organization but most importantly, to those who in fact make your product or deliver your service.

Tuesday, October 15, 2013

3 Steps for a Successful 5S Program


Seiri, Seiton, Seiso, Seiketsu, and Shitsuke. The 5S program is not new. It has been around for at least 30 years, and it has helped organizations of all sizes in developing a better and safer workplace for employees of any industry. But 5S cannot be just another flavour of the month. The easiest steps of the program (the first 3 Ss) are a lot of fun to execute. They have a visual appeal and instantly deliver change in the workplace. Indeed, the hardest part is the organization's mind changing that will set the workplace ready for the program's longevity. In this post, we offer our audience three steps to make your 5S program last. To learn more about 5S, please visit the links provided below. You can also find dozens of books written about 5S for sale.

1. Establishing ownership: an orphan 5S program is nothing else than political compliance or simply stated, waste of time and money. Large corporations usually pick "champions" or "owners" to be the sponsors of the program, from training to execution. Small- and mid-size companies usually have their owners as the main sponsor. Whoever the organization chooses to be in charge, it is vital that someone is in fact in charge. It is equally important that this someone truly believes that the program will make the organization a safer, more productive, and better workplace - the old "walk the talk" adage.

2. Education: we have seen, in many occasions, a 5S program going down the drain because of lack of education. And we really mean education, not training. Employees need to comprehend why the program is about to be in place, and how the program will change their lives at work. Often, 5S is delivered as a housekeeping program, and a housekeeping program 5S is not. The main idea is to improve the well being of all, not only employees but also customers, vendors, and even the community around your business. The program per se includes housekeeping, but it is far from being it only.

3. Allocating a budget (or not): have no fear, in most cases, a low 5S budget can still make a huge change in the workplace. Furthermore, if the organization simply wants to contract third parties to rebuild, repaint, or even manage the program, it will not achieve the main idea of ownership and commitment from employees. The best 5S programs we have seen did not require a lot of capital or external contracting to be successful. Employees in most cases, when committed, use their intelligence and creativity rather than the company's funds. Of course, inevitably there will always be those cases in which spending is mandatory, but any company can start the program with zero cash for it.

A well implemented 5S program depends on many variables. These are only a few of them, but if the entrepreneur has these simple 3 steps in mind, s/he is off to a great start. If your organization does not have a 5S educated person, and if it is difficult to educate someone onsite, eZSigma can help you to turn your organization into a pleasant and productive workplace.

Selected links:

Tuesday, October 8, 2013

Using Scatter Diagrams to Understand Two Variables’ Relationship


Have you ever wondered why a certain product sells more in a given season? Have you thought about how complicated forecasting sales would be without any indication of when your organization should produce more or less? What about hotel chains, how do they work around the optimum occupancy rate?

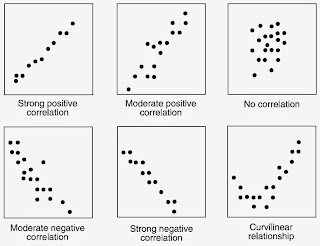
A Scatter diagram is one of the Seven Traditional Quality Tools. It offers business practitioners an easy way to understand what the correlation between two variables is. But why is it important for you to know that? Imagine that your efforts in either hiring temp workers, or producing a product, or selling a course revolves around not only market demand but also around when the demand exists. Now imagine the amount of defect parts your process produces exactly when you receive shipments from a certain supplier. Understanding the correlation between two variables does exactly that: it lets you explore the possible impact of an independent variable on a dependent variable.  Let’s work with a simple example: consider the relationship between water consumption during a marathon in the summer and the temperature outside. I can certainly state that the hotter it is outside the more water a runner tends to consume. I believe you’d agree with that. Now let us switch gears. Can I say that the more water a runner consumes the hotter it is outside? Not really, the temperatures in the summer have nothing to do with how much water one drinks.

There is also a formula for calculating the relationship between two variables (called correlation coefficient). Excel can easily and quickly calculate that for you. (Check link at the bottom of this post). Furthermore, it is equally important to understand if the two variables you are studying have a weak or a strong correlationship, or if they have a correlationship at all. The image placed at the top of this post shows the more important types of relationships. Put yourself to the challenge: what are the types of relationships your process may have? As always, eZsigma is here to help in case you need further education on this and other topics related to the Seven Quality tools and process improvement.