Showing posts with label process. Show all posts

Monday, October 28, 2013

SIPOC, Understanding Your Process' Elements

Utilized for process elements identification, and usually applied in the Measure step of  the DMAIC approach to process improvement (see posting on DMAIC within this blog), a SIPOC diagram is a useful tool to understand what your process is made of. It is visual, it lists the main components of each of the main foundations of a process, and can easily be applied in any industry. The acronym SIPOC stands for Suppliers, Inputs, Process, Outputs, and Customers. SIPOC expands on the basic operations management concept of input-transformation-output, by adding those who supply the raw material and/or information (suppliers) and those who ultimately receive the product being produced or the service being delivered. To illustrate such effort, we have chosen an easy process, one that many of us have undoubtedly performed before: making a peanut butter and jam sandwich.

Let us consider the figure below:


Suppliers: in this example, we want to know which organizations are actually supplying the tools, raw materials, and/or information we need to kick off my process. Grocery store, Hydro co., and hardware store.

Inputs: in this column, we want to list all of the needed supplies my process needs to produce the product or deliver the service. When working with process improvement initiatives (such as Lean), the idea is to build a SIPOC on a "as is" basis, i.e. current state. Here we have bread, peanut butter, jam, and other supplies.

Process: what are the steps needed for the process to transform the inputs into something else? Be mindful of processes that produce a good or deliver a service: either way, there will always be transformation happening, and that is the main point here. As you can see from the figure above, we have listed the steps needed to make the inputs become the product.

Outputs: simply stated, the goods and/or services being delivered: a peanut butter and jam sandwich in this example.

Customers: these may be your final consumer(s) or perhaps the next process that receives what you are in charge of producing/creating. In our example: hungry kids rushing out of the house in the morning.

The usage of a SIPOC diagram can effectively help your organization to develop a pictorial mapping of your processes' elements along with their gaps. Through its various process improvement programs, eZSigma can help customers of any industry to develop, apply, and sustain process improvement initiatives. Get in touch to learn more about eZSigma or visit our website at www.ezsigmagroup.com 

Tuesday, October 8, 2013

Using Scatter Diagrams to Understand Two Variables’ Relationship


Have you ever wondered why a certain product sells more in a given season? Have you thought about how complicated forecasting sales would be without any indication of when your organization should produce more or less? What about hotel chains, how do they work around the optimum occupancy rate?

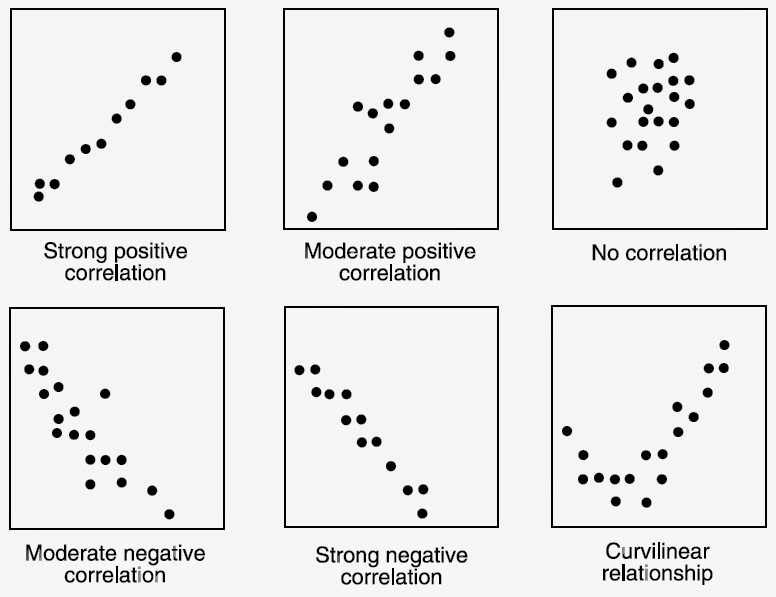
A Scatter diagram is one of the Seven Traditional Quality Tools. It offers business practitioners an easy way to understand what the correlation between two variables is. But why is it important for you to know that? Imagine that your efforts in either hiring temp workers, or producing a product, or selling a course revolves around not only market demand but also around when the demand exists. Now imagine the amount of defect parts your process produces exactly when you receive shipments from a certain supplier. Understanding the correlation between two variables does exactly that: it lets you explore the possible impact of an independent variable on a dependent variable.  Let’s work with a simple example: consider the relationship between water consumption during a marathon in the summer and the temperature outside. I can certainly state that the hotter it is outside the more water a runner tends to consume. I believe you’d agree with that. Now let us switch gears. Can I say that the more water a runner consumes the hotter it is outside? Not really, the temperatures in the summer have nothing to do with how much water one drinks.

There is also a formula for calculating the relationship between two variables (called correlation coefficient). Excel can easily and quickly calculate that for you. (Check link at the bottom of this post). Furthermore, it is equally important to understand if the two variables you are studying have a weak or a strong correlationship, or if they have a correlationship at all. The image placed at the top of this post shows the more important types of relationships. Put yourself to the challenge: what are the types of relationships your process may have? As always, eZsigma is here to help in case you need further education on this and other topics related to the Seven Quality tools and process improvement.


Wednesday, October 2, 2013

Using DMAIC to Improve Your Processes

You may have heard of the acronym, especially if you have had some exposure to the powerful and widely known Six Sigma methodology. But what does DMAIC mean and how is it properly used? Allow us give you a hint: no matter how mature an organization is on process management and control, there is always room for improvement.

DMAIC stands for Define, Measure, Analyze, Improve, and Control. It is the core framework behind the Six Sigma approach, and it has helped many organizations in the betterment of their processes. Although a must in any Six Sigma project deployment, DMAIC can also be used on its own. In fact, many quality practitioners use DMAIC as a way of introducing continuous improvement to novice users. DMAIC utilizes a step-by-step approach that is meant to effectively look into undesirable results and bring improvement to any organizational setting (although the focus has been on manufacturing, the framework can be applied to any industry). The following is a brief explanation of how DMAIC is deployed. As always, EZSigma can help your organization in the implementation of this and many other improvement methods.

D (Define): a team charter with clear expectations of high impact projects is a vital component and deliverable of this step. Usually, the team responsible for the project will write down the problem statement,  the main metrics related to it, and the potential opportunities that the organization can gain with an established improved process. Clarity is the key word here.

M (Measure): perhaps the most time consuming step. Data collection can be done through the use of quality tools such as check sheets and/or automated reading systems (PLC). The use of video recording and interviews are also commonly used, but the more quantitative data the better.

A (Analyze): once factual data have been collected, many other tools can aid in the analysis of process behaviour: control charts, scatter diagrams, and regression analysis are just a few of them.

I (Improve): the word redesign is often used in this step. Practitioners look for solutions to the issue or undesirable result previously identified and confirmed by thorough data collection and analysis. The new process is then tested - hypothesis testing and design of experiments (DOE) are often used here.

C (Control): in order for the new process to be sustainable in the long term, a control plan is developed with the sole objective of locking in the newly and better implemented process. The establishment of a routine management program can also help in this step.

Thursday, September 26, 2013

Welcome !

It is our pleasure to announce the creation of our first blog on strategic management, continuous and process improvement, Lean, Six Sigma, and much more. Our objective here is to educate, provoke critical thinking, and consult with our current customers, prospect clients and associates on best practices for the continuous effort in helping companies to perform better, in all aspects. Counting on a cast of experienced consultants and business practitioners, eZSigma's blog will offer to its audience practical tips on the various approaches and methods we live by, and teach to others. We would like to encourage yourself as well as your employees, associates and friends, to participate in the forum for the betterment of our organizations and personal professional journey. So please spread the word, let it be known that eZSigma's blog has arrived and it is bringing some valuable information to the world of great management.